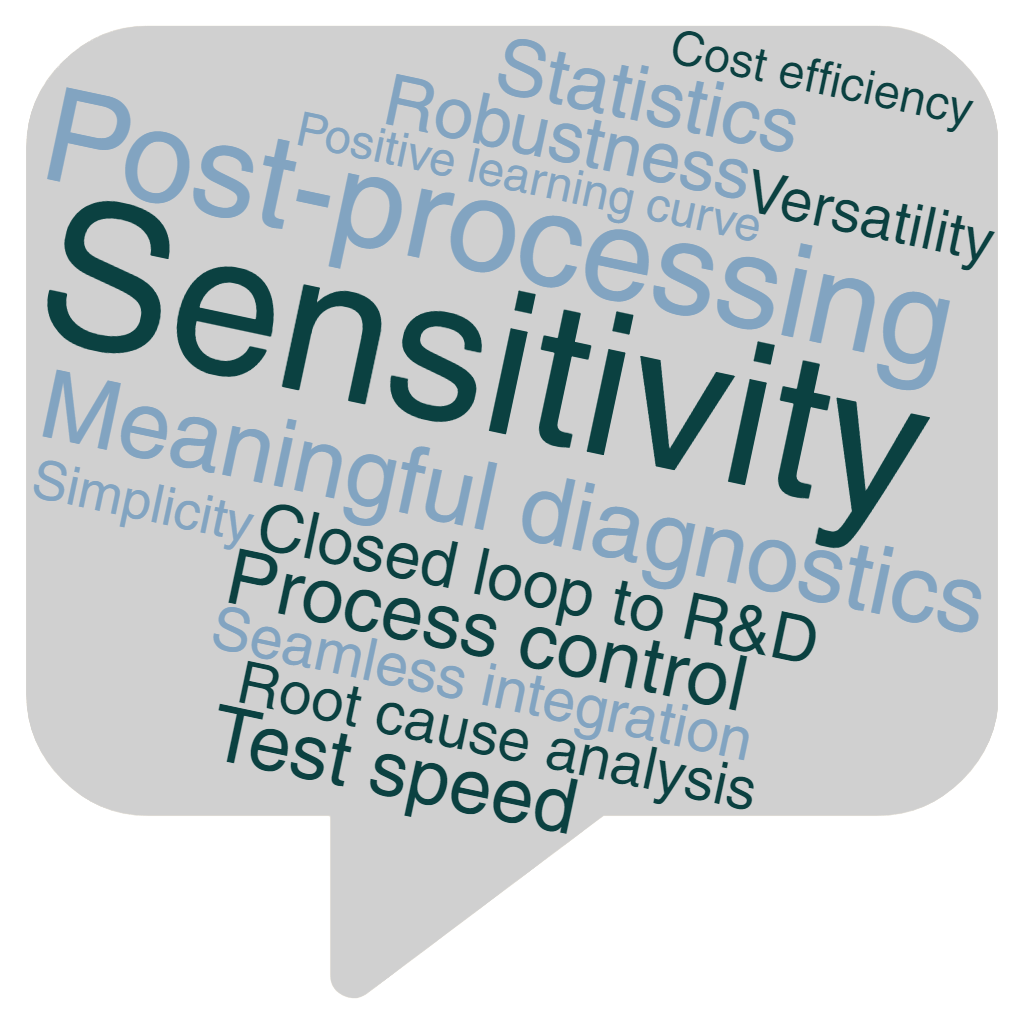
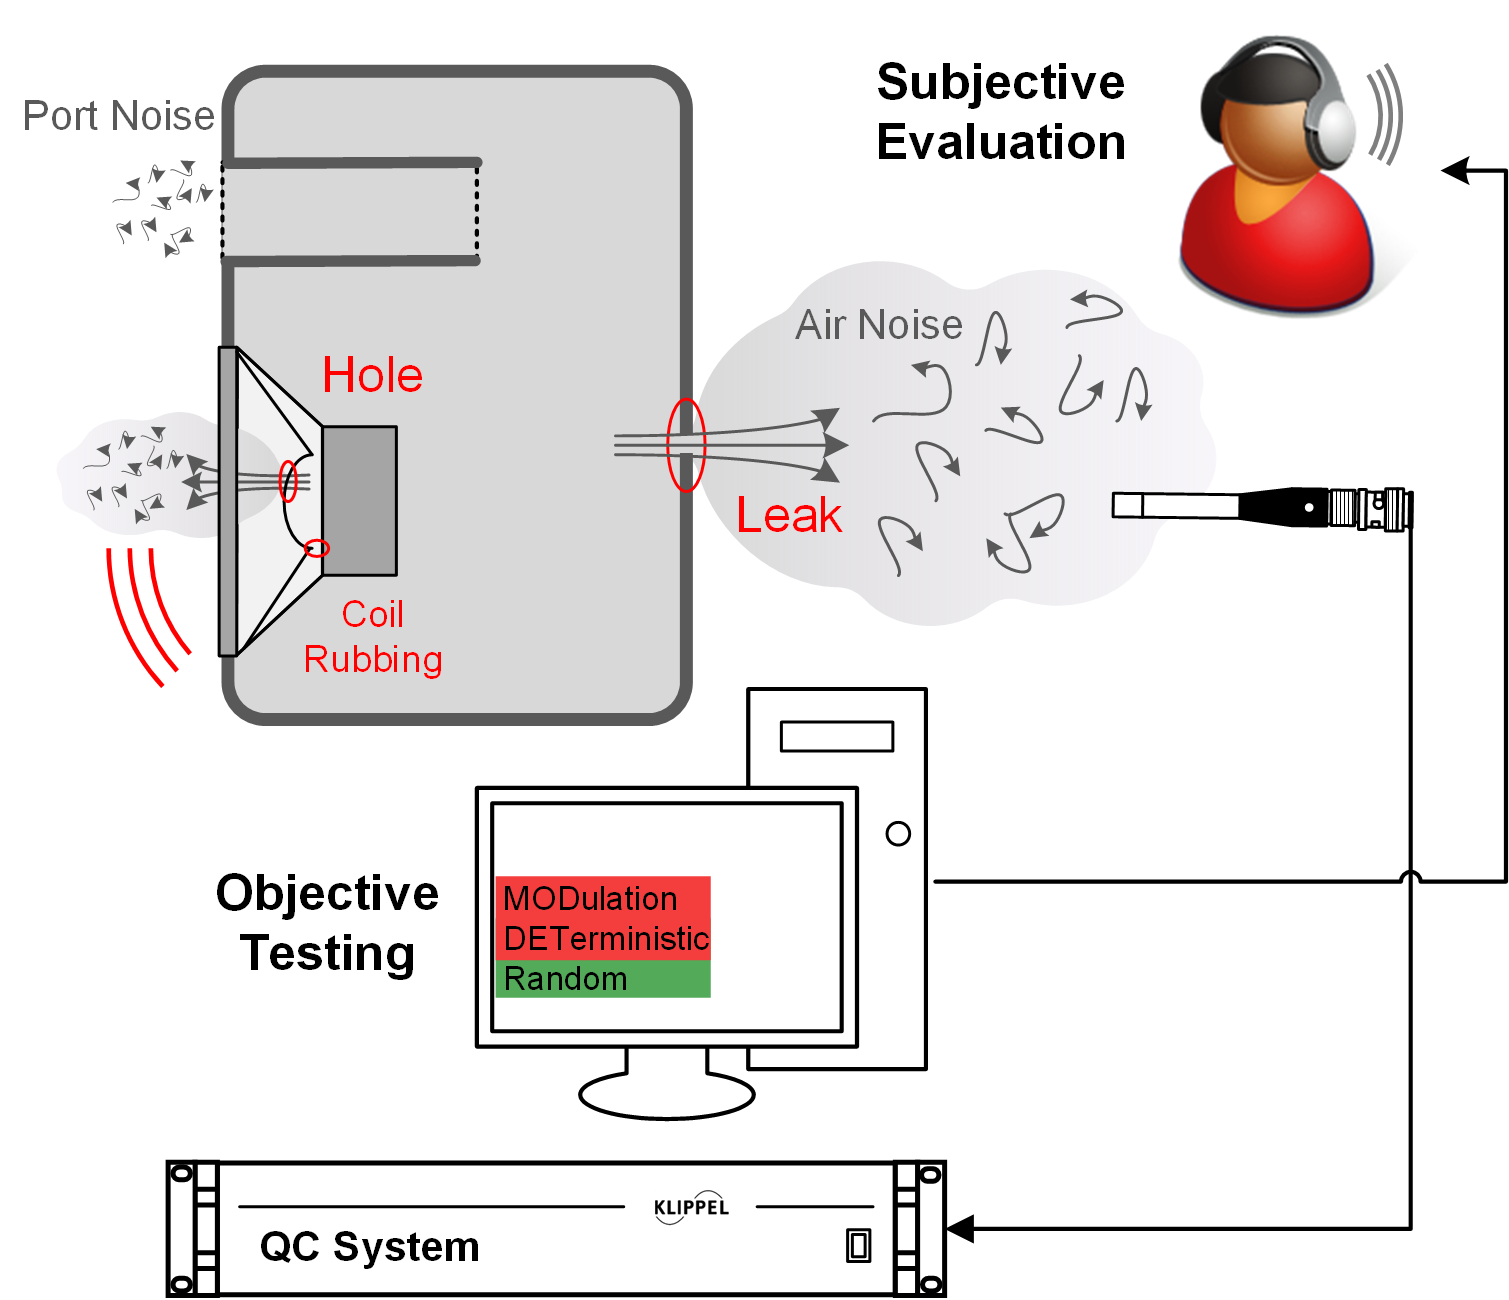
QC Unique Features
End-of-Line Testing Is Much More Than Distinguishing Between Good and Bad Units
For manufacturers of audio equipment, such as speaker components, speaker units, and speaker systems, it is necessary to test the performance and sound quality of the final product in mass production to control the quality. EoL testing is much more than separating good from bad units. It is also about using the information contained in the defects to improve the design and optimize the production processes. That requires a detailed, sophisticated analysis that must be done using the latest insights in electro-acoustic, including nonlinear modeling, mechanical models, FEM, simulation and many more.
Characteristics of End-of-Line Testing
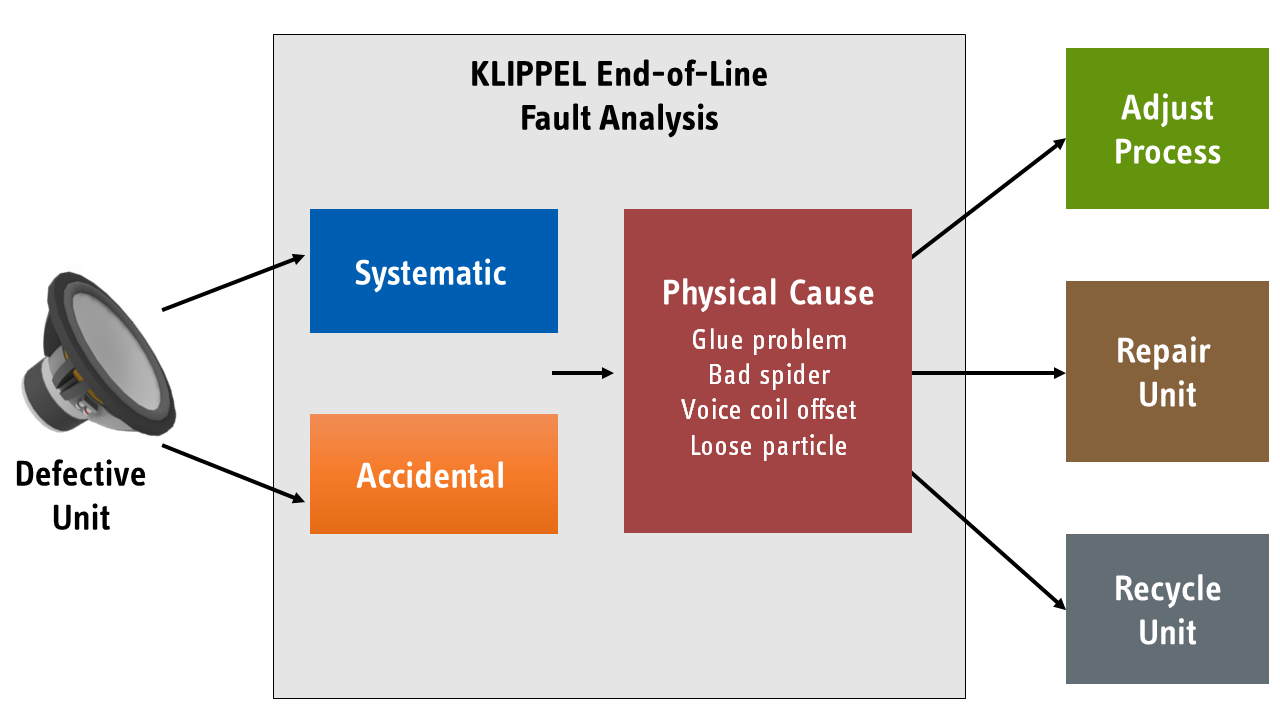
The physical causes of defective units reveal in many cases a potential way to avoid problems. Learning from existing failures and building a knowledge base significantly shorten the identification of similar problems in the future. This considerably eases actions to adjust the production process and invest money in development on the most relevant points. The QC System has a series of unique features, most of which are protected by patents and are not available in other testing systems. Below is a more detailed list of these unique features, along with the relevant KLIPPEL QC product solutions.
QC Unique Feature List
1. Log Sweep with Speed Profile - Reliable Defect Detection Within a Minimal Time
Speed is very important for End-of-Line (EoL) testing and it is significantly affected by the choice of test stimuli. The most accurate way of measuring a DUT’s behavior is through steady-state measurements. This implies that the acquisition begins when the amplitudes of all state variables (e.g., pressure, excursion, current) are settled and constant after the test stimulus is applied. The time it takes for state variables to settle and become constant depends on the resonance frequency and the quality factor of the fundamental and other higher-order modal resonators (cone breakup modes).
In EoL testing, a certain error is usually tolerated in exchange for minimizing the overall excitation time. Pre-excitation time can be reduced by allowing an error range of e.g., 4% in the measured amplitude. To ensure proper excitation of all critical resonators, stepped sine signals can be used with confidence.
When using stepped sine signals, with knowledge of the maximum quality factor found in the modal resonances of the DUT, the optimum frequency spacing and number of periods for every step may be calculated to ensure proper excitation for every critical resonator. We know that time is inversely proportional to frequency, and thus the low-frequency range requires longer excitation time, as shown in the blue curve in the following figure.
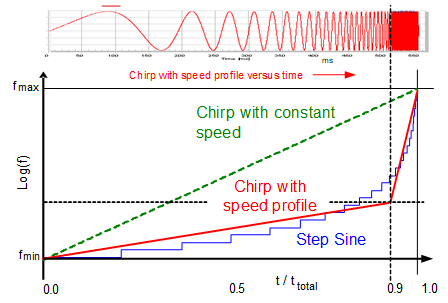
The minimum number of excited frequencies in one octave (resolution) is the most critical parameter for exciting resonators by stepped sine stimulus. If too coarse, certain defects that can only be triggered at a specific frequency cannot be detected. A too fine resolution on the contrary, will result in an excessive overall test time that slows down the cycle time of the production. Therefore, the logarithmic chirp has become the most popular stimulus for acoustic testing in manufacturing. It is based on a sine signal and can excite all frequencies by continuously changing frequency with a constant sweep speed (green dashed line).
Compared to the stepped sine signal, the slope of the chirp in the time-frequency mapping at low frequencies is greater than that of the stepped sine, but smaller at higher frequencies. The optimal sweep speed is limited by the maximum resonator quality factor at lower frequencies. This slow speed is not required at high frequencies and unnecessarily increases the measurement time. For fast testing of electro-acoustical devices, the ideal stimulus is a combination of the dense excitation inherent in the chirp and the time-frequency mapping of the stepped sine.
To achieve this, the sweep speed shall not be constant but rising with higher frequencies. This is the basis for ultra-fast testing at the physical limits. The chirp would be fastest if the sweep speed was continuously changing. In practice, only two sections of different but constant speeds are present, which is shown as the thick solid line in the figure above. This approach is implemented in the Klippel QC System. As an example, for a full audio band chirp (20 Hz to 20 kHz) with a sweep speed that is five times higher above 1 kHz than at lower frequencies, the test time is reduced to 53% of a traditional chirp with constant sweep speed.
2. More Sensitive than the Human Ear - Meta Hearing Technology (MHT)
Detecting defects (aka Rub & Buzz) through acoustic symptoms like abnormal noise and impulsive distortion is one of the key targets in End-of-Line testing of audio devices and is traditionally performed by human listeners. Performing listening tests to assess loudspeaker quality in the production line is a major issue due to their cost and subjective nature, making the results unreliable. In addition, some barely audible loudspeaker defects may worsen over time. Some defects have random symptoms that are difficult to identify, such as loose particles rattling inside the system under test. Furthermore, the noise generated during the production process can sometimes mask the symptoms of a defect. Finally, the conditions (e.g., orientation, acoustical load) in the production line are very different to the final application and the end user may use more critical stimuli for perceptual evaluation.
To overcome these challenges, we need objective methods for testing loudspeakers and audio systems. These methods should be faster, automated, and provide reliable results that are more sensitive than the human ear. They should be comparable to research and development standards, unaffected by background noise, and pinpoint the underlying cause of any defect.
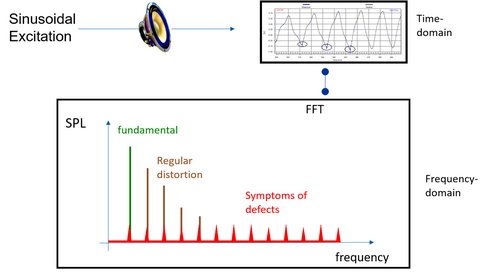
When testing a speaker for impulsive distortion according to IEC 60268-21, an excitation signal (chirp) is used to excite the speaker. The measurement microphone records the response signal, which is converted to the frequency domain using FFT. However, to extract high-frequency distortion components, a tracking filter with a variable cutoff frequency is used in the time domain. By this approach, the phase information is considered which helps to detect impulsive defects with maximum sensitivity.
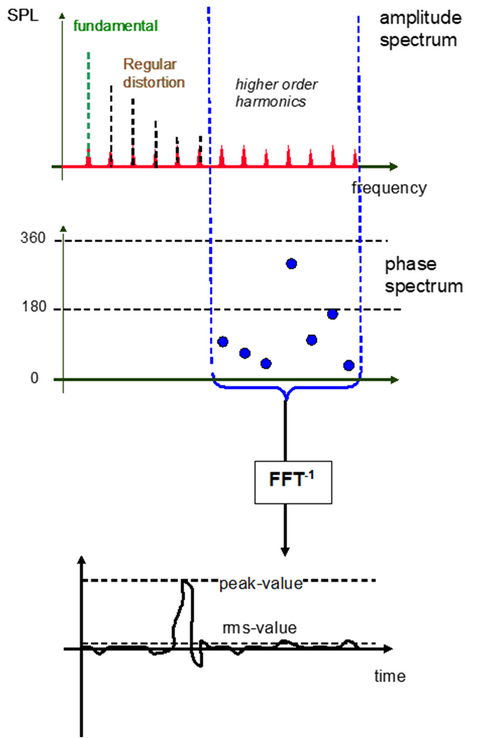
However, while extracting high-frequency components, regular nonlinear distortion, which can also be found in good units, is included. This distortion increases with excitation voltage. The defect symptoms, however, do not increase significantly with voltage and have almost constant energy spread over the whole audio spectrum. Therefore, with a high level of voltage, defect symptoms can be masked by regular nonlinear distortion.
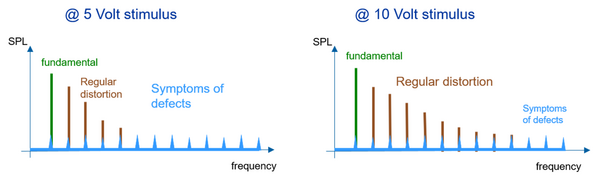
To overcome this issue, it is possible to increase the order of the high pass filter, as shown in the upper right figure, but this will decrease the total energy and thus also the sensitivity.
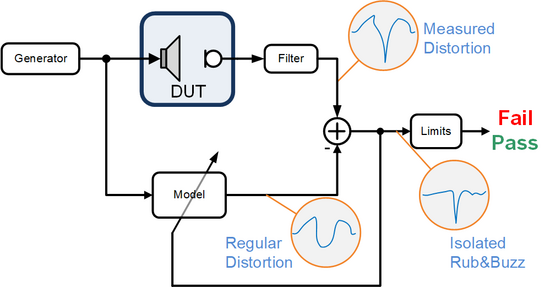
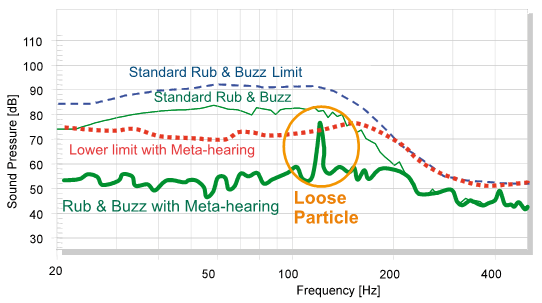
The Klippel solution, known as the Meta Hearing Technology (MHT), is a patent-protected technology that employs adaptive modelling to learn the inherent “regular” distortion of good units, such as a golden DUT. This technology then separates the distortion caused by speaker defects from the measured distortion to actively compensate for the masking effect of regular distortion. Compared to standard impulsive distortion analysis, the MHT solution offers up to 20 dB more sensitivity in detecting potential problems as early as possible. For instance, the click energy produced by loose particles is relatively low and can be completely masked by the regular distortion generated by motor and suspension nonlinearity. However, these defects can be detected by MHT before they worsen and become audible. Therefore, the MHT solution is crucial in detecting potential problems in the early stages so that they can be prevented from becoming serious issues.
3. Noise Microphone Detects Environmental Noise - Avoiding False Rejects
Audio products are tested under controlled conditions during the research and development phase without significant external disruptions. However, End-of-Line testing is done in a production environment that involves various noises and vibrations including those from machines, alarms, and goods trucks which can create unpredictable acoustic interference that may be of the same magnitude as the symptoms of defects. At times, short-term or impulsive disruptions can be generated and can easily reach 100dB SPL which can significantly affect the accuracy of acoustic testing, leading to false rejects.
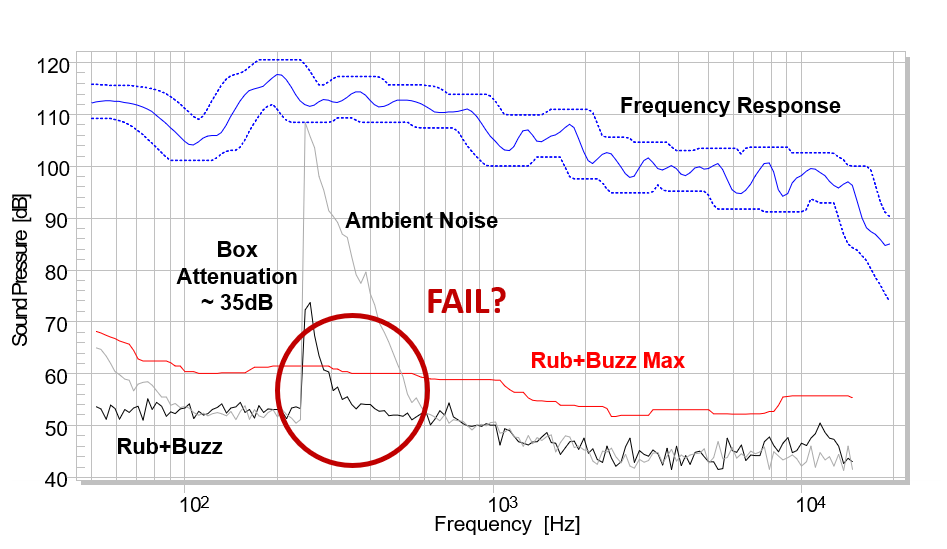
To mitigate production noise, various strategies can be employed. A passive solution is to use a test box that isolates noise and vibration in the workshop. A well-designed test box can attenuate disturbances up to 40dB, which is enough for amplitude frequency response and in most cases for THD, but not sufficient for impulsive distortion such as Rub&Buzz.
Below is an example of a well-designed and well-made test box that provides almost 35dB attenuation. During testing, the DUT (Device Under Test) was found to be "Good". However, when clapping hands simulated an impulsive ambient noise, the test results showed that this disturbance caused Rub&Buzz at the main test microphone in the test enclosure to exceed the allowed limit by 15dB, resulting in a false Fail verdict.
In practical end-of-life (EoL) testing, aside from using test boxes, additional steps are necessary to determine if the Device Under Test (DUT) is defective. One simple method is to repeat the measurement if a failure occurs, but this will more than double the test time and the repeated measurement may also be subject to interference. Therefore, it's difficult to reliably determine the root cause (defect or production noise) and avoid false rejects.
KLIPPEL has come up with a solution to this problem by using a second microphone to monitor the production noise outside the test box. This helps to convert the signal into an equivalent disturbance inside the test box, which can then be compared with the test signal measured by the test microphone and the limit values.
By using this method, if both the calculated equivalent disturbance and the test microphone signal exceed the limit, the cause is identified as "Noise" and the final test result is displayed accordingly. On the other hand, if only the test microphone signal exceeds the limit and the equivalent disturbance does not, then the DUT is considered defective and the result is "Fail".
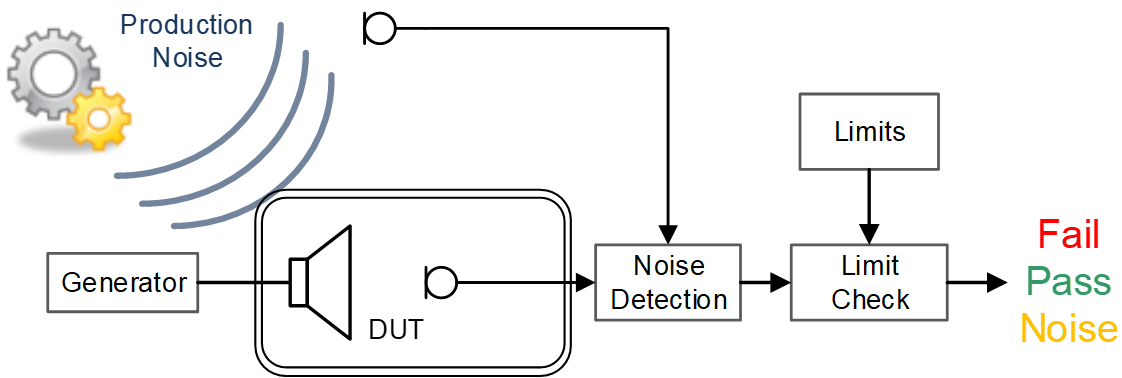
This unique feature is available for free in the QC Standard software. We highly recommend utilizing this feature if you're already a QC Standard user. You can easily integrate a noise detection microphone (we recommend the cost-effective GRAS microphone Mic 40PP-10 IEPE) to avoid false rejects and pinpoint the root cause of the test result.
4. Avoiding False Rejects and Repeating Test Automatically - Production Noise Immunity (PNI)
In the previous article, it was mentioned that during QC testing on the production line, a second microphone should be added, along with a test box, to isolate production noise and vibration. This will help monitor the noise level and accurately determine if the measurement is corrupted due to noise disturbance, rather than showing a false negative result and labeling the Device Under Test (DUT) as defective. Now, the question arises: what should be done if the verdict is "NOISE" due to environmental noise disturbance? The conventional method is to repeat the test until completely undisturbed, which is unsuitable for modern automated production lines and increases measurement time and costs. But what if there was a way to automatically repeat this test of the disturbed results?
KLIPPEL's solution is based on reliable noise detection known as Production Noise Immunity (PNI) technology, which is protected by patents. PNI technology is used to automatically repeat the test in case of environmental noise disturbance, through unique splicing technology. This ensures accurate results in a minimal time frame, making it an ideal solution for modern automated production lines.
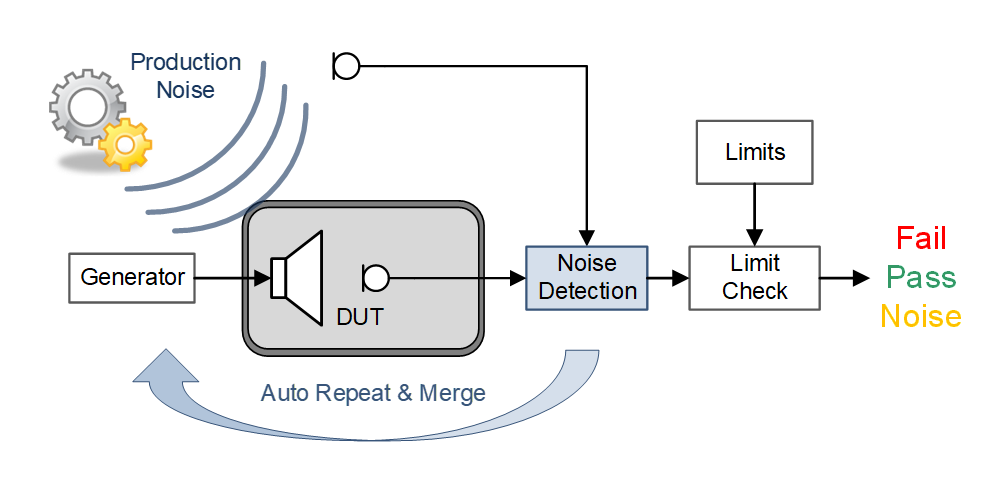
As demonstrated in the example below, the DUT has been tested and determined to be "Good". During the measurement process, random ambient noise is simulated by clapping hands. In the first measurement result, most of the Sound Pressure Level (SPL) frequency response is corrupted by noise (gray parts). Without the noise monitoring feature mentioned in the previous article, the test would result in a "FAIL" and the DUT would be sorted into the defective group. With noise monitoring but without the Pass/Fail No Influence (PNI) feature, the test verdict would be "NOISE". However, with the PNI feature, a repetition of the disturbed results will be activated automatically. This is beneficial to store uncorrupted parts of each measurement and merge them with valid parts of the following repetitions, resulting in a complete valid set of data eventually, and giving a "PASS".

As mentioned above, the PNI module relies on reliable noise detection. This smart repeating and splicing technology is a key element of ultra-fast testing, providing immunity against random production noise. This feature can be applied not only to the SPL task to ensure the measurement of frequency response, polarity, harmonic distortions, and Rub&Buzz, but also to check the Air Leak Detection (ALD) results.
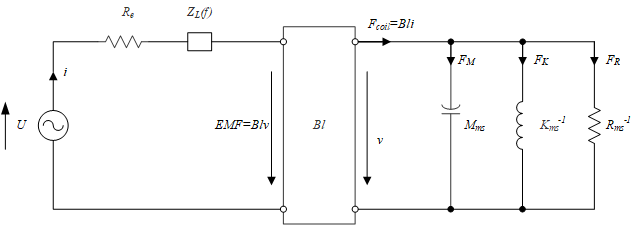
5. Ensuring Stability, Maximum Qutput and Low Distortion - Motor and Suspension Check (MSC)
The large signal behavior of electrodynamic transducers is characterized by various nonlinear mechanisms, mainly related to the suspension and the motor. They define the sound quality, stability and maximal output of the final audio system. The nonlinear characteristics of a transducer are already set during the design phase restricted by price, size, weight, and the target market.
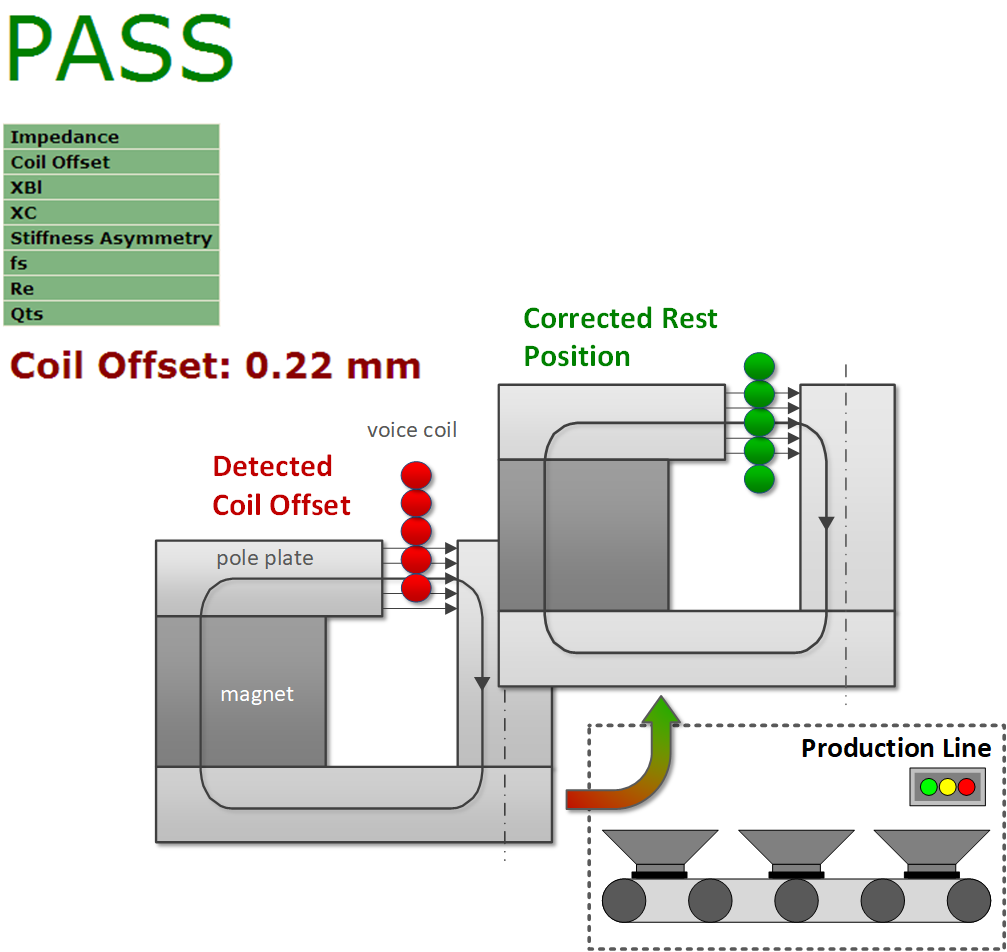
Although the components such as the magnet and pole plates have a fixed geometry, their nonlinearity could be considered stable in the manufacturing, but we have to consider the variation in the moving parts, especially the soft parts – suspension, it could cause a voice coil offset from its ideal position and dramatically degrade the overall performance of the audio system, especially for highly efficient transducers with very nonlinear motors (see figure below).
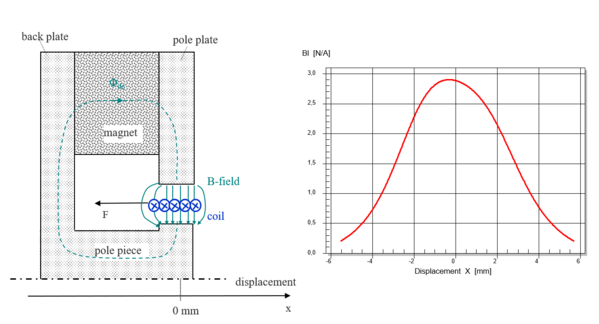
In the above figure, the voice coil is centered in the magnetic field (optimal position), and the Bl (x) curve is very symmetrical with a maximum value close to X=0. But as long as the voice coil moves, the effective Bl value will decrease and cause compression and signal distortion (harmonic distortion, intermodulation distortion) in the sound pressure output.
If the rest position of the voice coil deviates from its optimal position, the Bl curve on the right side of the figure above will also be shifted on the x-axis, introducing additional asymmetry, resulting in up to 5% second-order harmonic distortion; And in the case of two-tone excitation, it is easy to generate 20% -40% broadband intermodulation distortion. Another effect of the nonlinear force factor Bl is the generation of dynamic DC displacement, which makes the transducer unstable, and the generated DC component can even further move the coil away from the optimal position. The above two issues (distortion and instability) may not have a significant impact on linear designed motors, but for some transducers such as microspeakers without self-limiting suspension, the signal limiter algorithms assume a symmetrical excursion range, and their displacement safety margin should be high to prevent mechanical overload from causing damage and Rub&Buzz. If the voice coil deviates from the optimal position, it will limit the maximum excursion, thereby reducing output.
As mentioned above, the nonlinear force factor Bl and its asymmetry can generate distortion (HD, IMD) in the output sound pressure signal. Traditional distortion measurement is a direct method, but there are the following problems:
- The intermodulation distortion mainly generated by nonlinear Bl should be measured using two-tone signals, which is a useful method for R&D, but it is not practical for EoL testing aimed at high efficiency.
- The harmonic distortion (THD/HD) in the output signal of the transducer is caused by various factors and is not a unique characteristic of the nonlinear motor. In some cases (such as when the motor and suspension system are both asymmetric), a coil offset can even reduce distortion. The distortion test on the production line is passed, but displacement limiting and stability issues still exist.
- Even if higher THD or second-order harmonic distortion isolates failed DUTs, it cannot provide more diagnostic information, such as the root cause, improvements, etc. It requires further evaluation by experts or R&D personnel, which is time-consuming and impractical.
Therefore, the EoL testing cannot just rely on distortion measurement. To ensure specified performance related to sound quality, stability, maximum excursion, and output, it is necessary to measure the position of the voice coil directly. Mechanical sensors (such as lasers) are not suitable for assembly and cannot evaluate the optimal position of the voice coil in a magnetic field.
KLIPPEL's solution is to add the Motor and Suspension Check (MSC) task to EoL test sequence. This module is protected by patent, only the voltage and current at the speaker terminals under large signal excitation need to be measured. The linear and nonlinear parameters (Bl (x) and Kms (x)) for transducers on the production line can be quickly identified by modelling with speaker nonlinear parameters, from which the meaningful single value parameters such as voice coil offset and suspension asymmetry are derived. This provides valuable information for taking immediate actions to fix the causes of loudspeaker distortion, maximum output limitation or stability issues.
MSC is not only suitable for second-order mechanical systems (driver unit in free air or closed box), but also for fourth-order systems with additional acoustic resonance caused by vented enclosure giving enclosure parameters fb and Qb. The identified large signal parameters (voice coil offset, suspension system asymmetry, etc.) can be compared to the measurement results of the Large Signal Identification (LSI) module in the KLIPPEL R&D system. MSC also supports running on the QC Stand-alone software version. In this case no KLIPPEL Analyzer hardware is required, but only professional amplifiers (like Powersoft MEZZO AD series) as 3rd party hardware integrating voltage/current sensing and audio streaming interfaces.
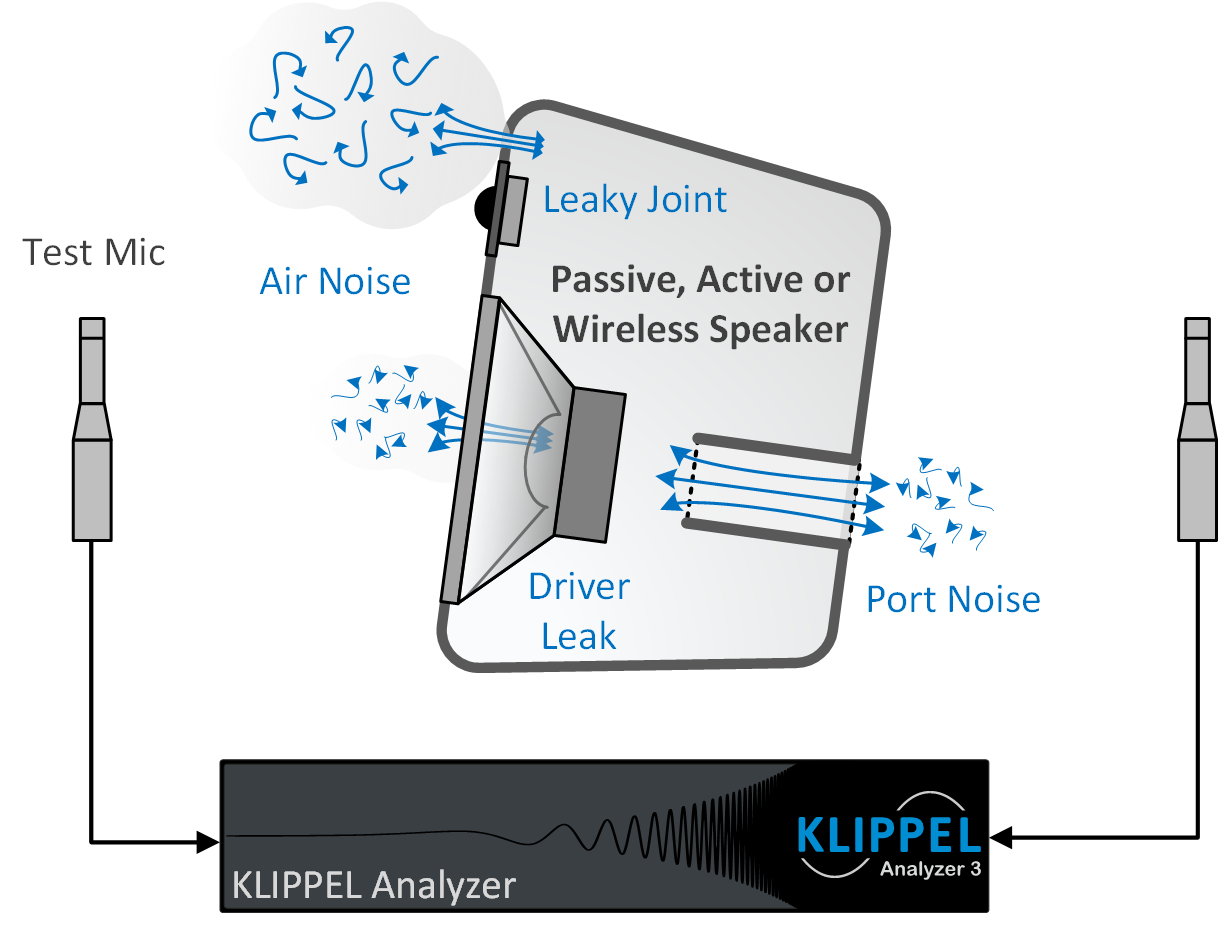
6. Acoustic Measurement and Leakage Detection in One Step - Air Leak Detection (ALD)
The sound generation in loudspeaker systems requires the compression of air and generates high air pressure in the enclosure. If the enclosure is not well sealed, air at high velocity will be expelled at those leaks resulting in turbulences that produce characteristic air noise. In passive loudspeaker systems, those leaks usually occur at the dust cap, surround, or somewhere in the cabinet. In vented systems, the port itself generates turbulent noise which may mask the symptoms of leaks. Modern active loudspeaker systems use sealed enclosures combined with active filtering in order to extend the bandwidth to lower frequencies. This is however much more prone to air noise because the air pressure inside the enclosure is increased significantly and electronic components such as switches and connectors require careful sealing.
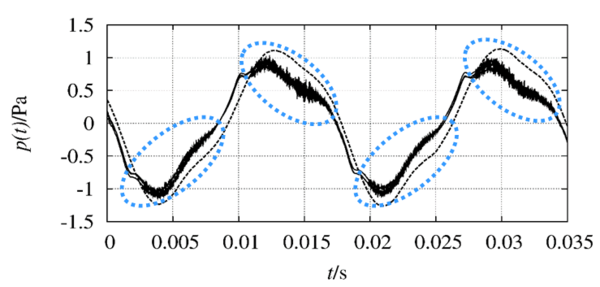
The air noise produced by leaks is mainly a stochastic process. The air pressure in the cabinet is modulated by the driver displacement and synchronized with the stimulus. The following example shows the waveform of a box excited by a sinusoidal stimulus at 60 Hz with a sealed enclosure (dashed line) and a leaky enclosure (solid line). The time signal shows that the air leak produces additional distortion components at the maximum positive and negative sound pressure. The repeated measurement at the leakage (the other solid line) shows that the fine structure of the distortion is different and stochastic, but the generated position is the same and has a deterministic envelope.
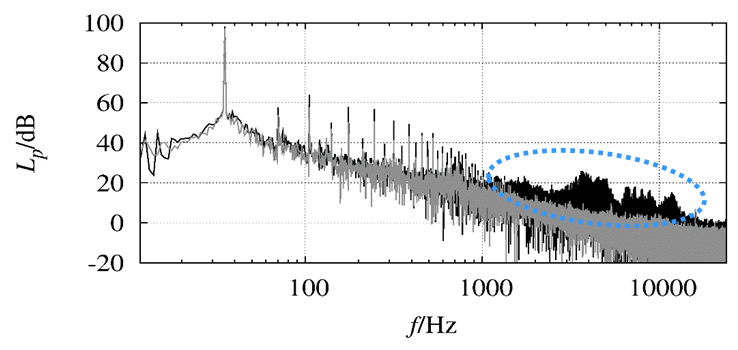
The frequency domain analysis shows that the harmonic components at low frequencies are almost the same and are caused by the nonlinearities of the motor and suspension. However, the broadband distortion (black curve) caused by leakage above 1kHz is about 20dB higher than in the sealed box (gray curve). These components not only include the higher order harmonics but also all the spectral components in between.
The high-frequency components of turbulent air noise are highly audible, which has a high impact on perceived sound quality. But those leaks are difficult to detect, especially in a noisy production environment. Traditional measurement techniques based on spectral analysis are not suitable because the power density is small and can easily be masked by microphone and ambient noise. Special techniques developed for rub & buzz analysis focusing on higher order harmonics (HOHD) or impulsive distortion are not sensitive enough since those are not typical symptoms of air noise.
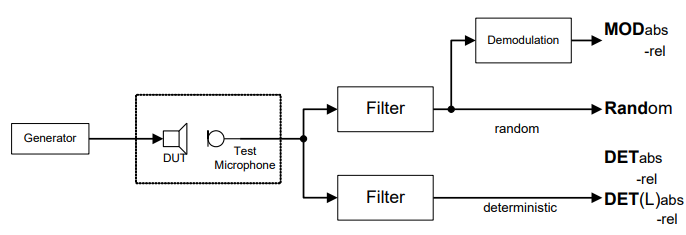
Therefore, KLIPPEL has developed a special technique to measure the air noise generated by turbulences at leaks and ports, which has been implemented in the Air Leak Detection (ALD) module of the KLIPPELQC System. This technique exploits some properties of the modulated noise visible only in the time domain: the envelope of the turbulent air noise is deterministic, which corresponds to the periodicity of the excitation signal. Through adaptive filtering, asynchronous demodulation of the air noise signal, and averaging of the harmonic components of the envelope, the absolute and relative distortion levels can be provided to qualify and quantify air leakage (modulation distortion MODabs/MODrel, as well as deterministic leakage distortion DET(L)abs/DET(L)rel). Additionally, this technique can characterize other speaker defects, such as voice coil hitting the backplate (deterministic distortion DETabs/DETrel) and loose particles (Random). The following picture shows the different measures and how they are achieved.
The ALD task can not only be added as a standalone task to the test sequence, using a low frequency to stimulate air leaks. It can also be integrated as an add-on to the SPL task. In this case, a defined frequency band of the sine sweep will be used to trigger air leak symptoms, and air leak detection will be completed simultaneously with standard acoustic testing. No additional measurement time is introduced in the measurement and the efficiency of EoL testing is therefore increased. In addition, the ALD task provides ambient noise detection to avoid false FAIL verdicts caused by external noise. When integrated into SPL tasks, disturbed measures can also be repeated and merged automatically in combination with the PNI module, providing accurate results in a minimal time.
7. Localize and Auralize Leakage - Air Leak Stethoscope (ALS)
In the last article of "KLIPPEL QC Unique Feature" we introduced the Air Leak Detection (ALD) module, designed to detect turbulent air noise generated by loudspeakers. This module can be added as a stand-alone task to the test sequence or integrated as an add-on to the SPL task, both methods being dedicated to end-of-line (online) testing.
Building on this, we now turn our attention to Air Leak Stethoscope (ALS), the offline counterpart to Air Leak Detection (ALD). The Air Leak Stethoscope (ALS) is designed to detect and locate air leaks and other audible defects in audio systems of all types and sizes. By exciting the test object with a low frequency tone, high pressure is created inside the box. The operator can then move the 'stethoscope' microphone around the DUT to locate the source of noise and distortion.
Despite their different applications, ALS and ALD share several key features. Both ALS and ALD use the same signal processing kernel and result parameters, employing special signal processing to assess and classify air noise and defect distortion. In the ALS result window, an additional color bar display intuitively indicates the distortion level relative to the background noise floor (green), eliminating the need for limits based on reference units.
To further enhance the evaluation process, ALS offers unique subjective assessment capabilities. To provide a subjective assessment of distortion, ALS suppresses the true test tone and lower order harmonics in the sound pressure response. The residual signal, including the distorted signal, can be played back immediately via the host PC's audio interface or exported and stored as a WAVE file for later evaluation. The use of isolated headphones not only protects the operator's ears from harmful sound pressure levels, but also enhances hearing sensitivity to auralize defect symptoms. This makes it possible to locate faults without the need for a PC monitor.
Unlike its online counterpart, ALS offers flexibility in test environments and has no specific acoustic requirements. However, anechoic or isolated rooms can improve performance due to low background noise. Sporadic interference is usually not critical for ALS offline applications, as measurements are repeated. However, the continuous noise level should be as low as possible. An additional ambient noise microphone can be used to identify noise disturbed tests and set the test result to invalid.
The Air Leak Stethoscope (ALS) module offers significant benefits to engineers by providing an accurate and flexible solution for detecting and locating air leaks and audible defects in audio systems. Its ability to operate in different environments without specific acoustic requirements makes it highly adaptable. The intuitive display of results and subjective evaluation capabilities ensure that even subtle defects are identified and corrected, improving the overall quality and reliability of audio products. By using ALS, engineers can achieve more accurate diagnostics and maintain high standards in their audio systems, ultimately leading to greater customer satisfaction and reduced return rates.
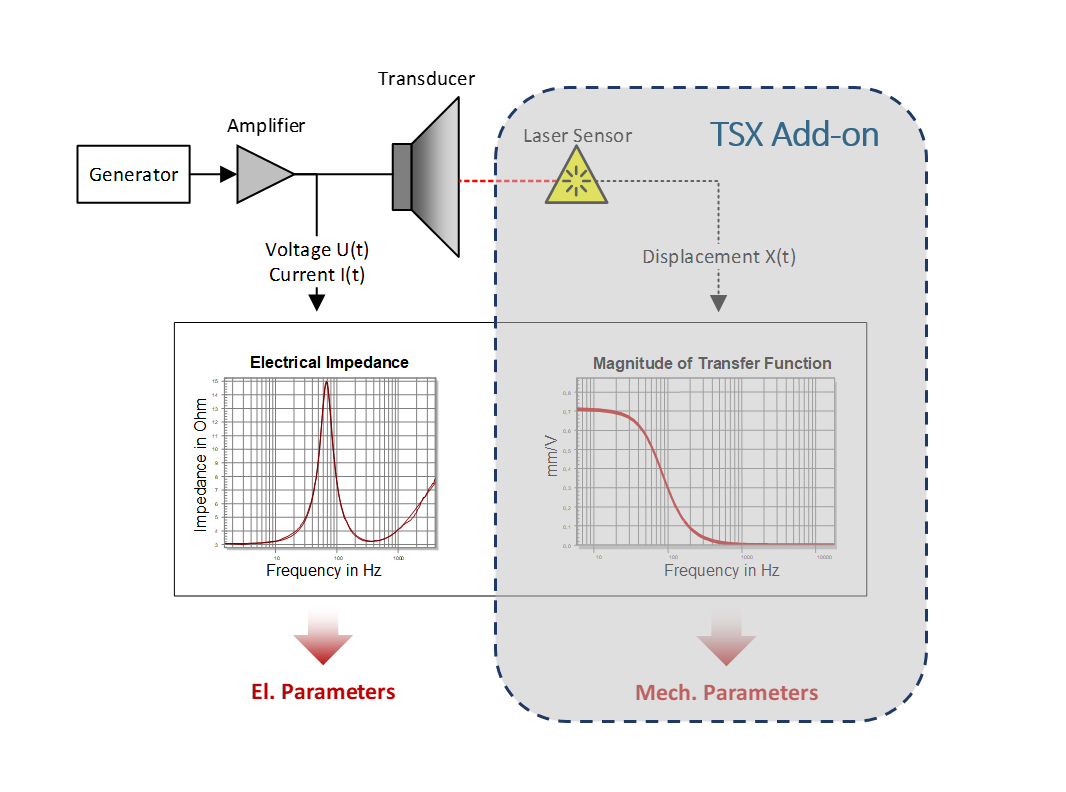
8. Test Full Data Sheet in Production Line - TS Parameter laser Fitting (TSX)
In today's manufacturing environment, accurate measurement and analysis of loudspeakers is essential for quality assurance. Our latest method of comprehensive data collection on the production line provides a detailed examination of the mechanical and electrical properties of loudspeakers.
At low frequencies, the wavelength is much larger than the geometrical dimensions of the transducer. The mechanical system can be modeled by lumped parameters, as shown in the electro-mechanical equivalent circuit model below. The left side of the circuit represents the electrical properties of the voice coil, while the right side describes the mechanical system of the transducer – a damped mass-spring-resonator.
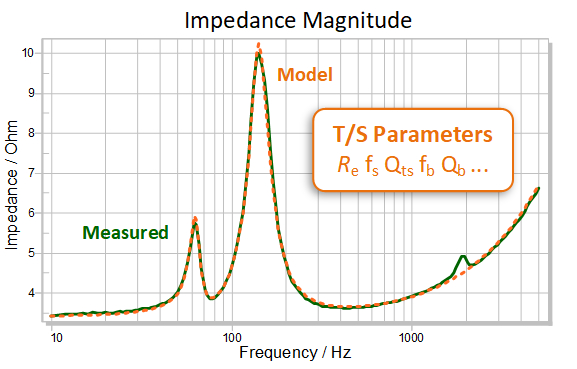
The impedance task (IMP) of the Klippel QC system calculates the electrical input impedance of the equivalent circuit by measuring only the voltage and current at the speaker terminals. It then fits this data with a lumped parameter model to determine the Thiele/Small parameters of the speaker. This process complies with international standards ICE 60268-5 and IEC 60268-22.
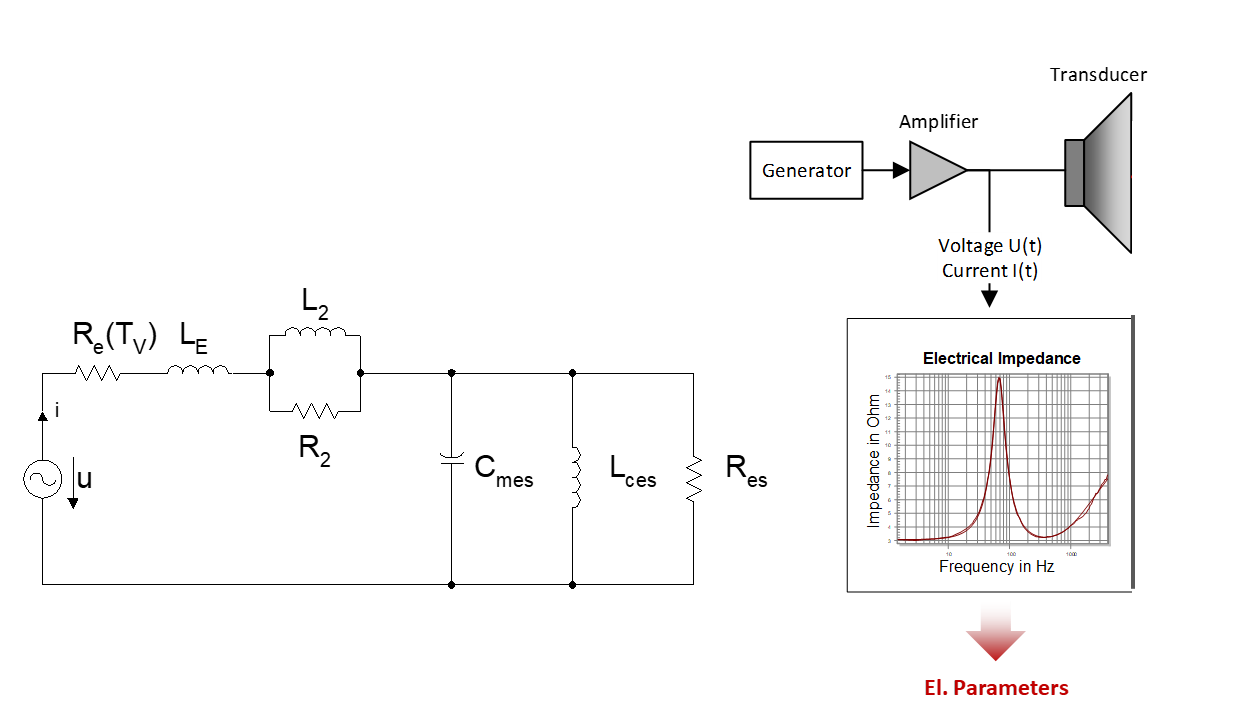
The following T/S parameters can be determined based on fitting the electrical input impedance:
- Re - Electric input resistance of voice coil
- Le - Voice coil inductance (LR-2 inductance model)
- Cmes - Electric capacitance representing moving mass (Mms) in mechanical system
- Lces - Electric inductance representing compliance (Cms)
- Res - Electric resistance representing mechanical losses (Rms)
- Fs - Resonance frequency of driver
- Qts - Total Q-factor considering Re and Rms only
- Qms - Mechanical Q-factor of driver considering Rms only
- Qes - Electrical Q-factor of driver considering Re only
To obtain the mechanical parameters of the speaker, a mechanical calibration must be performed to calculate additional mechanical parameters:
- Bl - force factor at rest position
- Mms - moving mass incl. air load
- Cms - mechanical compliance of suspension
- Kms - mechanical stiffness of suspension
- Rms - mechanical resistance of mechanical driver losses
- Vas - equivalent air volume of suspension (diaphragm area Sd must be specified)
There are two methods for mechanical calibration:
- Input known Bl or Mms value: I n the IMP task, manually input the known Bl(x=0) or Mms value directly. If both values are unknown, or if you want to confirm changes in Bl/Mms for the same batch of products on the production line, use the second method.
- Use TSX add-on module: As an add-on feature of the IMP task, TSX can be activated by selecting “Laser” as the mechanical calibration method in the IMP task (TSX license required). This method enhances the impedance-based lumped parameter fitting of the IMP with state-of-the-art laser displacement measurement. With dedicated stimuli and advanced fitting algorithms, including suspension creep, accurate transducer parameters such as force factor Bl, moving mass Mms, mechanical stiffness Kms, and losses Rms can be determined in one step. This method is ideal for comprehensive production monitoring process control, and root cause analysis.
If the test object is a driver mounted in an enclosure with a single vent or a passive radiator (resulting in a 4th order resonant system with two impedance peaks), additional box parameters can be identified by selecting the correct DUT type (Driver in Vented Box) in the IMP task:
- fb: Enclosure resonance frequency (port/passive radiator)
- Qb: Total enclosure Q including leakage (Ral) and port losses (Rap)
With these methods and technologies, you can ensure that your loudspeakers meet the highest quality standards. Take advantage of advanced measurement systems to optimize your production processes and satisfaction.
9. Pool-based Data Post Statistics - Statistics (STAT)
Using Klippel QC during the production process ensures the quality of DUTs. However, the QC system primarily focuses on testing the running production line. Keeping track of production yield and performing statistical analysis can be challenging, especially when multiple testing lines are used simultaneously or when analyzing the overall factory output. At this point, a post-processing tool is needed to globally analyze QC data from the production lines, detect early production issues, and improve overall production efficiency.
TheKlippel Statistical (STAT) module is a powerful data post-processing tool that can be applied not only for comparing prototype data during development but also for global statistics of EoL test data, including curves and single value results. After importing these data into STAT through the data extraction tool dB-Extract, corresponding processing can be performed to visualize the statistical information in charts (curve plots, histograms for single values, and cross-section views of curves) and overview tables.
A major feature of the STAT module is that DUT data sets can be easily organized into pools (e.g., “good,” “bad,” “borderline”) manually or based on user-defined thresholds (limits).
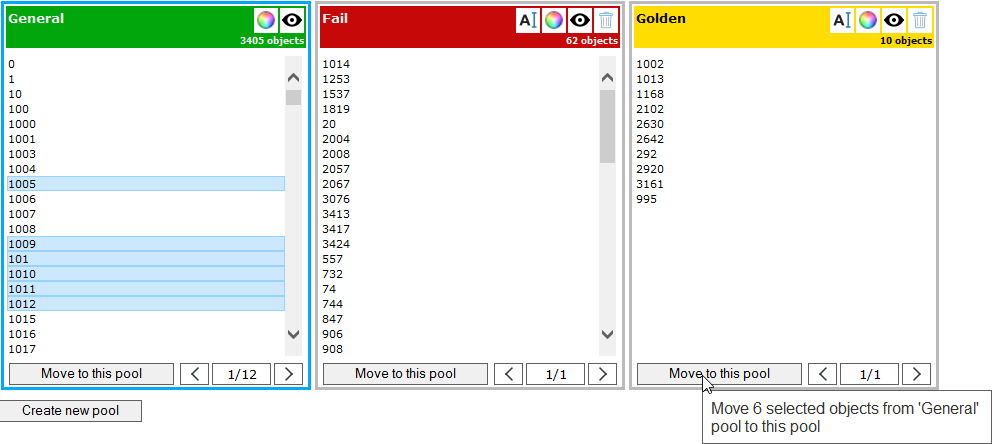
Limits can either be defined by specifying the number or by using the intuitive point-and-click feature directly in the charts. These limits can be used to create new pools or be exported and transferred to the QC software for an optimal ratio of quality and yield. Furthermore, the advanced golden unit detection algorithm provides a ranking of representative units based on user-selected parameters.
STAT can assist with root cause analysis, comparing design options, generating production limits, identifying outliers, classifying data, and more. This tool is both convenient and efficient, especially suitable for analyzing and comparing small and medium-sized batches or prototypes. For large-scale data, it is recommended to use third-party tools such as WATS. Please refer to the Klippel application note AN81 for more details.
10. Control Rules - Monitoring Process Stability
Imagine if the glue dispenser on the production line became unstable after a long period of use, failing to place the voice coil correctly and applying too much glue. The speakers then become defective and can have an undesirable effect on performance. You could sell these defective products at a lower price, but this could conflict with your quality standards and image. Alternatively, you could destroy them, wasting resources and increasing costs. The best approach is to avoid such situations altogether. Klippel QC provides a unique tool - control rules. It detects trends in the early stages to determine when production is failing and intervenes in the production line in time to prevent the production of defective products.
This free feature provides a predefined set of control rules - for example, Nelson/WeCo control chart rules, which are part of statistical process control. By drawing control charts based on process parameters and control limits, the stability and abnormal situations of the process can be assessed according to the points on the control chart. This helps to detect and solve problems in the production process in a timely manner, optimize production processes and equipment, and further improve production efficiency and product quality.
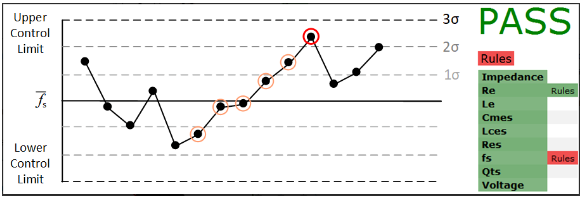
The overall indicator of the control rule depends on the activated individual rule results. As shown in the figure above, the overall rule indicator is true (shown in red) because the control rule for action fs is enabled and its results are true. The QC software also provides a detailed rule results table that specifically shows the individual rule results for each action.
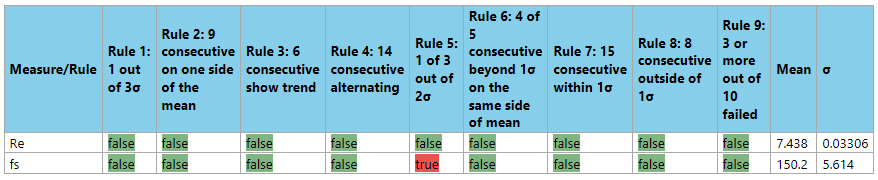
In addition to using preset control rules, custom control rules can also be defined based on the verdict history, the time course, and statistical values (mean and standard deviation) of single value test results such as fs, Re, or voice coil offset.
As you have read in our series of blog articles, the general and unique features of the KLIPPEL QC System solutions, as a powerful part of the KLIPPEL Analyzer System, can efficiently and quickly identify defective products in the production line, reliably control the quality of the DUT and monitor the stability of the production process. We hope we have been able to show you that end-of-line testing is much more than distinguishing between good and bad units.